
Rice University is an institution steeped in tradition and committed to unparalleled excellence. We are working to become the premier university in the world for teaching and research, with an ambitious vision to preserve what we cherish as unique to our institution while innovating to meet the future needs of our students and the world. Accordingly, Rice University uses multiple criteria to document student success and assesses its effectiveness with respect to student achievement by monitoring trends in:
- Overall undergraduate 6-year (150%) graduation rate (Student completion indicator),
- First-time, first-year undergraduate student retention,
- Undergraduate first-destination after graduation,
- Doctoral time to degree.
Achievement goals and outcomes data for each criterion are detailed below. Goals are presented for each metric along with a rationale for selection of the metric and goal.
- Criterion One: Six-year Graduation Rates
-
The six-year IPEDS graduation rate is Rice’s selected Student Completion Indicator on file with SACSCOC. The six-year IPEDS graduation rate was selected as Rice’s Student Completion Indicator because it is an important metric that the university regularly evaluates as part of its goal to provide an outstanding undergraduate education and for continuous improvement purposes.
The goal for the six-year graduation rate is for the rate to be at or above 90%. 90% was selected as the threshold of acceptability for the IPEDS six-year graduation rate, based on a review of AAU institution peer data. AAU is comprised of 71 leading research institutions (69 in the US and one in Canada), including Rice, and therefore provides appropriate comparators. The AAU US institutions’ six-year graduation rate average reported in 2020 is 84%. Setting the graduation rate goal at or above 90% far exceeds the AAU US institution average. The 90% goal also allows Rice to remain competitive with its peer institutions, which have graduation rates above 90%. The institution’s data is based on IPEDS data and methodology. Rice's Board of Trustees annually reviews the 6-year graduation rate trends and how Rice compares to our AAU Private peers. Table 1 demonstrates Rice’s high achievement on the six-year graduation rate student completion indicator over the past five years.
Table 1: IPEDS Six-year (150%) Graduation Rates (SACSCOC Institution Selected Metric)
Graduation Rates
Entering Cohort
Fall 2014
Fall 2015
Fall 2016
Fall 2017
Fall 2018
6-year (150%) Graduation Rate
94.2%
92.3%
93.6%
95.7%
94.6%
Source: IPEDS data; Prepared by Rice University Institutional Research & Analytics, January 2025
Results Analysis: Six-year Graduation Rate
As shown in Table 1, Rice consistently exceeds the goal of 90% for overall six-year undergraduate graduation rates. The success of the overall high graduation rate may be attributed to Rice’s many layers of support for student achievement described later in this narrative, as well as the general “culture of care” present across the university.
- Criterion Two: Undergraduate Retention
-
An important criterion for Rice is the retention rate for first-time, first-year (FTFY) undergraduate students. Undergraduate retention rate is selected as a metric because it supports the institutional priority of providing an excellent undergraduate education and because of the emphasis on Rice’s “culture of care,” which is intended to promote an outstanding campus experience. Retention rates at Rice for FTFY undergraduate students are expected to meet or exceed the Rice AAU peer average retention rate for FTFY undergraduate students in Fall 2019, which is 92.2% (retention rate goal). The Fall 2019 AAU peer average is selected because it is the first year for which the five-year trend data is reported and analyzed for the purpose of understanding retention rate in this narrative. Full-time is defined as a student enrolled in at least twelve semester credit hours. Retention rate data is sourced from IPEDS and is adjusted for allowable exclusions, which include the death of a student, permanent disability, military deployment, or service on an official church mission or with a foreign aid service of the Federal government. Table 2 demonstrates Rice’s success in achieving high FTFY undergraduate retention over the past five years.
Table 2: First-time First-year Undergraduate Retention Rates
Cohort Year
Fall 2019
Fall 2020
Fall 2021
Fall 2022
Fall 2023
FTFY Undergraduate Retention Rate
96.7%
97.1%
98.1%
97.6%
97.4%
Source: IPEDS data; Prepared by Rice University Institutional Research & Analytics, February 2025
Results Analysis: Undergraduate Retention
Using the Fall 2019 AAU peer average retention rate of 92.2% as the goal, Rice outperformed in each of the reported years as shown in Table 2. Rice’s exceptional support for undergraduates academically and personally accounts for the high retention rate.
- Criterion Three: Undergraduate First-destination Outcomes
-
Rice selected undergraduate first-destination outcomes as the third metric for measuring student achievement because as a highly ranked national research institution, understanding where our undergraduates go in their first year after completing their first undergraduate degree is important to continued excellence. First-destination outcomes data also helps Rice assess how it performs against national averages on this metric, which helps improve Rice’s competitiveness. Rice University’s Center for Career Development (CCD) monitors the first destination of undergraduates after graduation. To collect the data, CCD follows the National Association of Colleges and Employers (NACE) First-Destination Survey standards and protocols. Rice is one of more than 300 institutions nationally that follows this protocol and contributes data to NACE’s national survey. The data is sourced through the annual First Destination Survey (administered by the Center for Career Development using the 12twenty tool), phone and email communication to non-respondents, and LinkedIn. The first-destination data presented includes bachelor’s-level graduates who graduated between July 1 and June 30 of the graduating class year. An 88% graduating senior first destination knowledge rate for years included in this analysis was achieved. The knowledge rate only dropped slightly as a result of the Covid-19 pandemic but returned to a minimum 95% for the three most recent years included in this analysis. In viewing the data, “Service” is Volunteer Service, officially defined by NACE as graduates who are participating in a volunteer or service program (e.g., Peace Corps, mission work). Military is omitted from the data due to no respondents reporting military service.
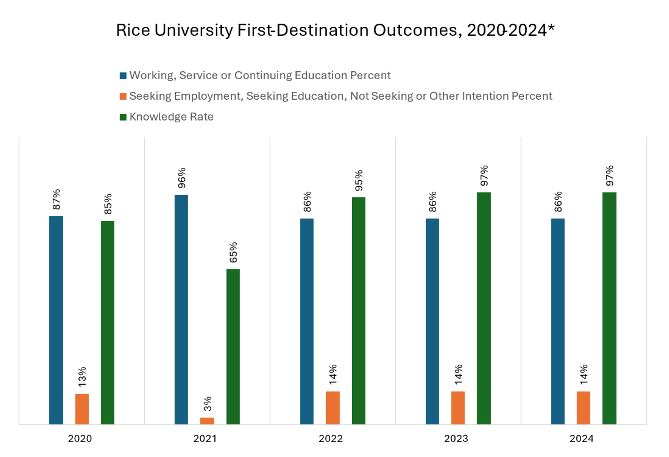
The goal for undergraduate first-destination outcomes in the first six months following graduation is that at least 82% of undergraduates are employed or pursuing continuing education. For the purpose of this analysis, students engaged in service are counted as employment. The threshold is set using the NACE annual reports national career success outcomes average in 2020, which was 82%. Rice’s First-destination Outcomes data for 2020-2024 is presented in Table 3.
Table 3: Undergraduate First-destination Outcomes, 2020-2024*
Results Analysis: Undergraduate First-destination Outcomes
As shown in Table 3, for all years included in this analysis the goal was exceeded with a minimum of 86% of students achieving the desired outcome within six months following graduation (years 2022, 2023, and 2024), 96% of students achieving the desired outcome in 2021, and 87% of students achieving the desired outcome in 2020. In 2021, Rice had a much lower knowledge rate than usual, at only about 65%. The lower knowledge rate in 2021 may be due to fewer students at the time knowing their next steps with certainty which can make them hesitant to report any information. Additionally, CCD experienced staffing changes in 2021 that limited their resources and ability to follow up with graduate non-respondents and conduct LinkedIn research as CCD did in other years to obtain a higher knowledge rate. The total desired outcome in 2021 may be exceptional due to the lower knowledge rate that year making the knowledge rate meaningful context. Overall, Rice is pleased with the first-destination outcomes of its undergraduate students and attributes this achievement to the many horizontal and vertical student achievement supports available at Rice.
- Criterion Four: Doctoral Time to Degree
-
Educational excellence, research and innovation are at the heart of Rice University’s mission statement and strategic plan. Doctoral time to degree is a key metric for Rice, as a highly ranked national research institution, ensuring that doctoral students complete degrees in a timely manner helps Rice to be competitive among peers and help ensure it contributes meaningfully to research and innovation in the US and globally. At Rice, doctoral degrees are offered in six academic schools and interdisciplinary doctoral programs are offered for Applied Physics students (as per the description appearing below Table 4). Analysis of doctoral time to degree includes all doctoral programs at Rice. It is important to note that time to degree for doctoral programs varies by discipline.
The target goal set for doctoral time to completion at Rice of 7.3 years is based on the 2018 reported median number of years to complete the research doctorate after starting graduate school per the National Center for Science and Engineering Statistics, Survey of Earned Doctorates (SEDS) which is used by many Rice peer institutions to set their threshold of acceptability. Rice University doctoral degree completion rates for the past five years are presented in Table 4:
Table 4: Rice University, Doctoral Time to Degree, Graduation Years 2020-2024
School
Academic Year of Graduation
2020
2021
2022
2023
2024
Interdisciplinary*
5.78
6.03
5.04
5.36
5.2
Jones School of Business
5.78
5.74
5.71
5.71
5.71
School of Engineering
5.36
5.55
5.03
5.36
5.03
School of Humanities
7.03
7.03
6.36
6.71
7.03
School of Music
5.36
3.73
3.71
6.71
5.71
School of Natural Sciences
5.78
5.74
5.36
5.36
5.36
School of Social Sciences
5.78
5.74
5.71
5.71
5.71
Total
5.78
5.74
5.36
5.36
5.36
*”Interdisciplinary” refers to applied physics students because they matriculate in natural sciences but then may specialize in an area of applied physics that resides in engineering. We place them in the “Interdisciplinary” school category because they may “major” in either school. Applied physics is not considered a dual degree program.
Prepared by: Rice University Institutional Research and Analytics November 2024
Results Analysis: Doctoral Time to Degree
Doctoral time to degree rates at Rice are consistently below the 7.3 year time to degree national median (and this criterion's goal) which is a positive outcome. The data reveals differences in the slightly longer time to degree for Humanities students which is typical nationally. The shorter time to degree for Music students may be related to the different nature of those doctoral programs. The high student achievement for doctoral time to degree may also be attributed to Rice’s culture of care and excellent support for students throughout their studies at Rice, where they receive peer and faculty mentoring, support from the Dean of Graduate and Postdoctoral Studies office, research librarians and staff in the respective schools and also at Fondren Library.
Contact Information
Rice University
Office of Institutional Effectiveness
Allen Center, Suite 215
P.O. Box 1892
6100 Main St.
Houston, TX 77251-1892